Products
MDC-Max
A COMPLETE MACHINE DATA COLLECTION SOLUTION
CIMCO MDC-Max is a complete MDC solution that benefits the one man operation with a few machines and the corporate enterprise with multiple factories. The MDC-Max software is highly flexible and easily customized to fit your current and future data collection needs.
CIMCO MDC-Max analyzes the data it collects and presents a variety of statistics and reports. This information can be directed to smartphones, tablets and TV-screens for real-time monitoring of your production. Since MDC-Max is a networked solution that stores data on a central server you can monitor production from multiple locations and access the data from anywhere.
Features
Automatic / manual data collection
Machine events can be collected automatically or sent manually by machine operators
Use existing network to monitor CNC machines
Supports Wireless, Ethernet, RS-232 and Parallel I/O
Real-time monitoring
Supports multiple "Live Screens" for displaying machine status on large TV screens, Web client and PC
Customizable Reports and Charts
Add production targets, work shifts or calculate KPIs such as OEE, MTBF and MTTR
Web Client for tablets and smartphones
See status of your machines or send operator events from any modern mobile device
Unlimited number of data collection events
CIMCO MDC-Max can be customized to collect information on any event
Multiple plant support
Monitor multiple plants and access MDC-Max from anywhere
DATA COLLECTION
When we talk about data what we actually mean is events. The first task when installing CIMCO MDC-Max is to consider what machine and operator events you want to collect information about.
MACHINE EVENTS (AUTOMATIC)
Machine events can be collected automatically by CIMCO MDC-Max and most installations will include events such as Cycle Start, Cycle Stop, and Part Complete as a minimum. When these events occur at a machine CIMCO MDC-Max is automatically notified and data about the event is stored.
OPERATOR EVENTS (MANUAL)
Operator event data is sent manually by machine operators. Using a smartphone, tablet, barcode scanner or PC an operator at a machine can send status information to CIMCO MDC-Max indicating specific events. Usually you want to collect downtime reasons such as Waiting for Setup, Waiting for Maintenance, Scrapped Part, Inspection, etc. CIMCO MDC-Max can be customized to collect specific information on any event.
The following diagram illustrates how Machine- and Operator events can be collected and stored by CIMCO MDC-Max. In this example the CNCs transmit events through a wireless network, however, MDC-Max can be integrated with any existing wireless, Ethernet or RS-232 serial network.
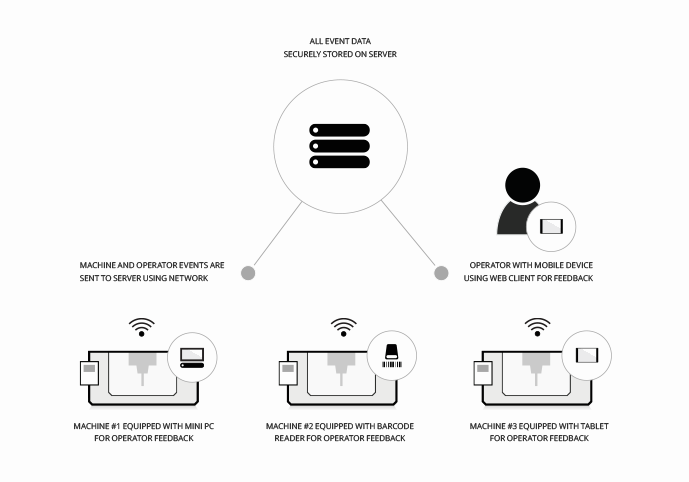
BASIC SETUP FOR MACHINE DATA COLLECTION
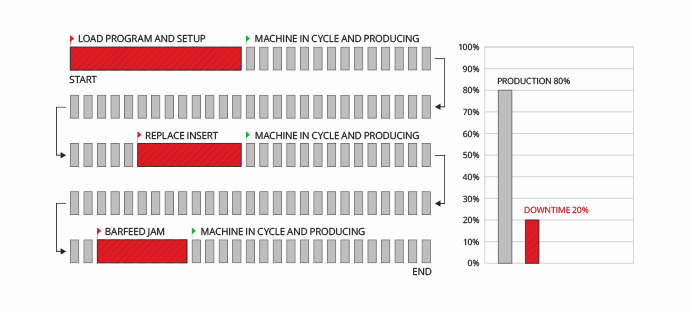
The majority of companies only want to know if a particular machine is running and producing parts or if it is stopped. With a basic data collection setup MDC-Max can show the amount of time the machine has been in production and the amount of time allocated to downtime.
ADVANCED SETUP FOR MACHINE DATA COLLECTION
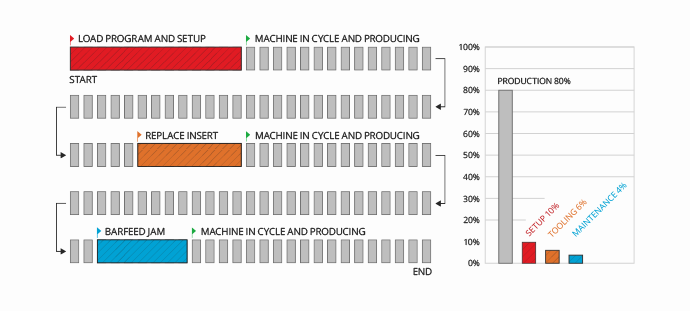
With the advanced data collection option MDC-Max can provide accurate reporting of machine tool efficiency on any job. MDC-Max can show the total percentage of downtime for each type of machine stoppage such as Tooling, Setup, Machine Maintenance, etc. This additional information is provided by the operator using a tablet or a barcode scanner. The operator uses the tablet or simply scans a barcode to indicate the downtime reason. This information can then be used to pinpoint exactly what is causing a loss of production.
GENERATE REAL-TIME AND HISTORIC REPORTS
In CIMCO MDC-Max data is structured and visualized as reports. You can setup MDC-Max to generate both real-time and historic reports based on the data collected. MDC-Max features a modern tabbed interface where each open report is shown in a separate tap. This maximizes screen space for each report while allowing many reports to be open and updating in the background.
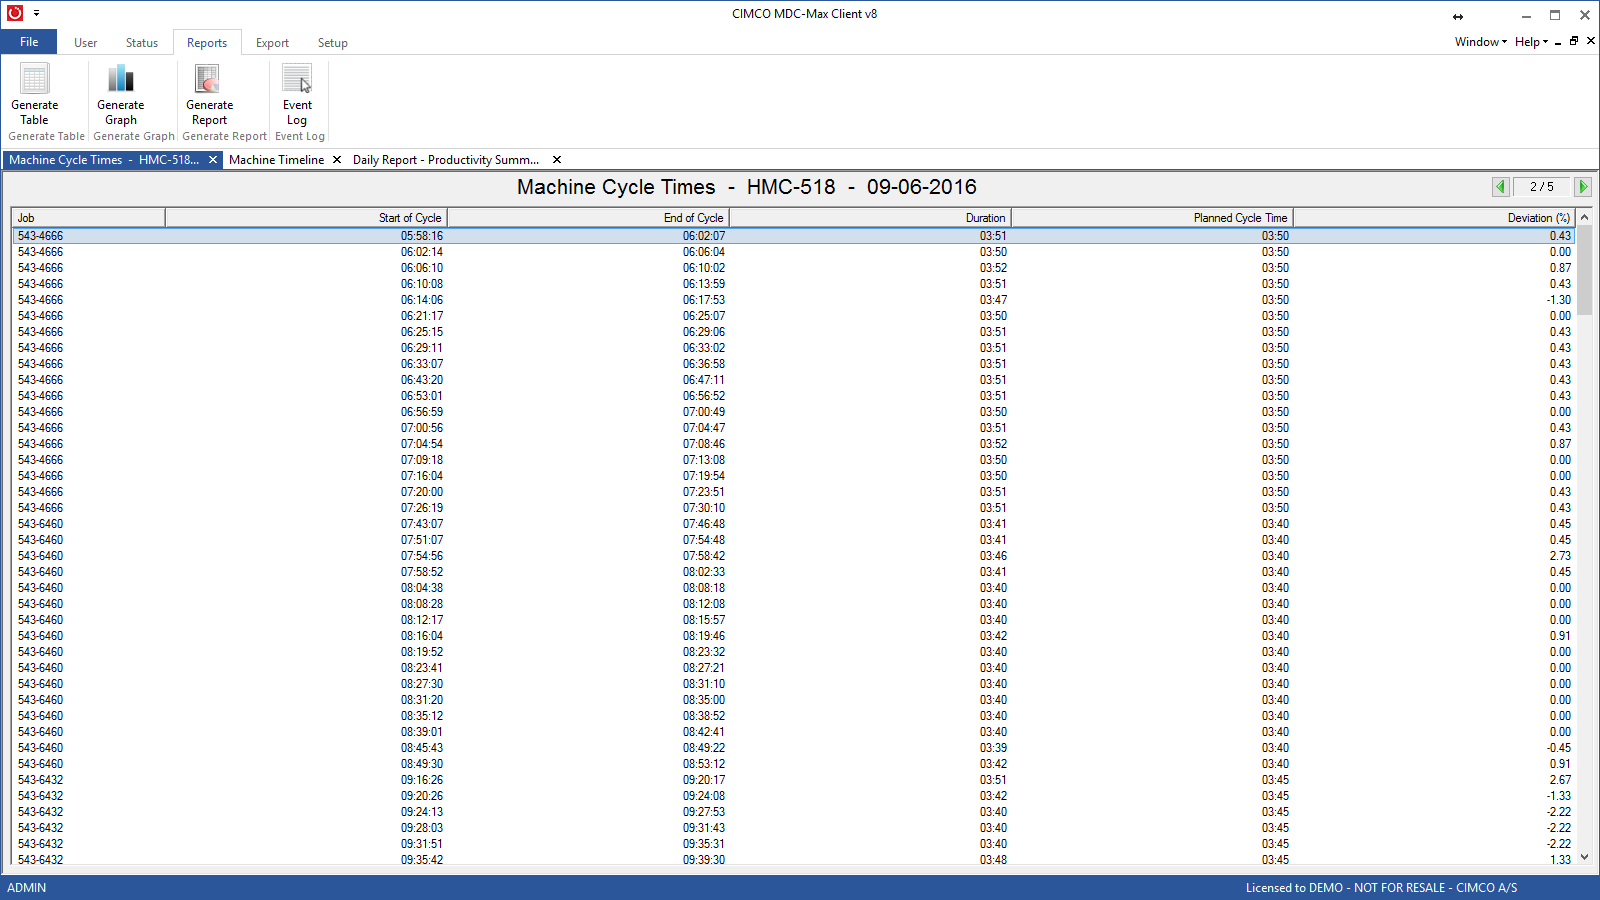
Utilization by cycle time, duration and deviation
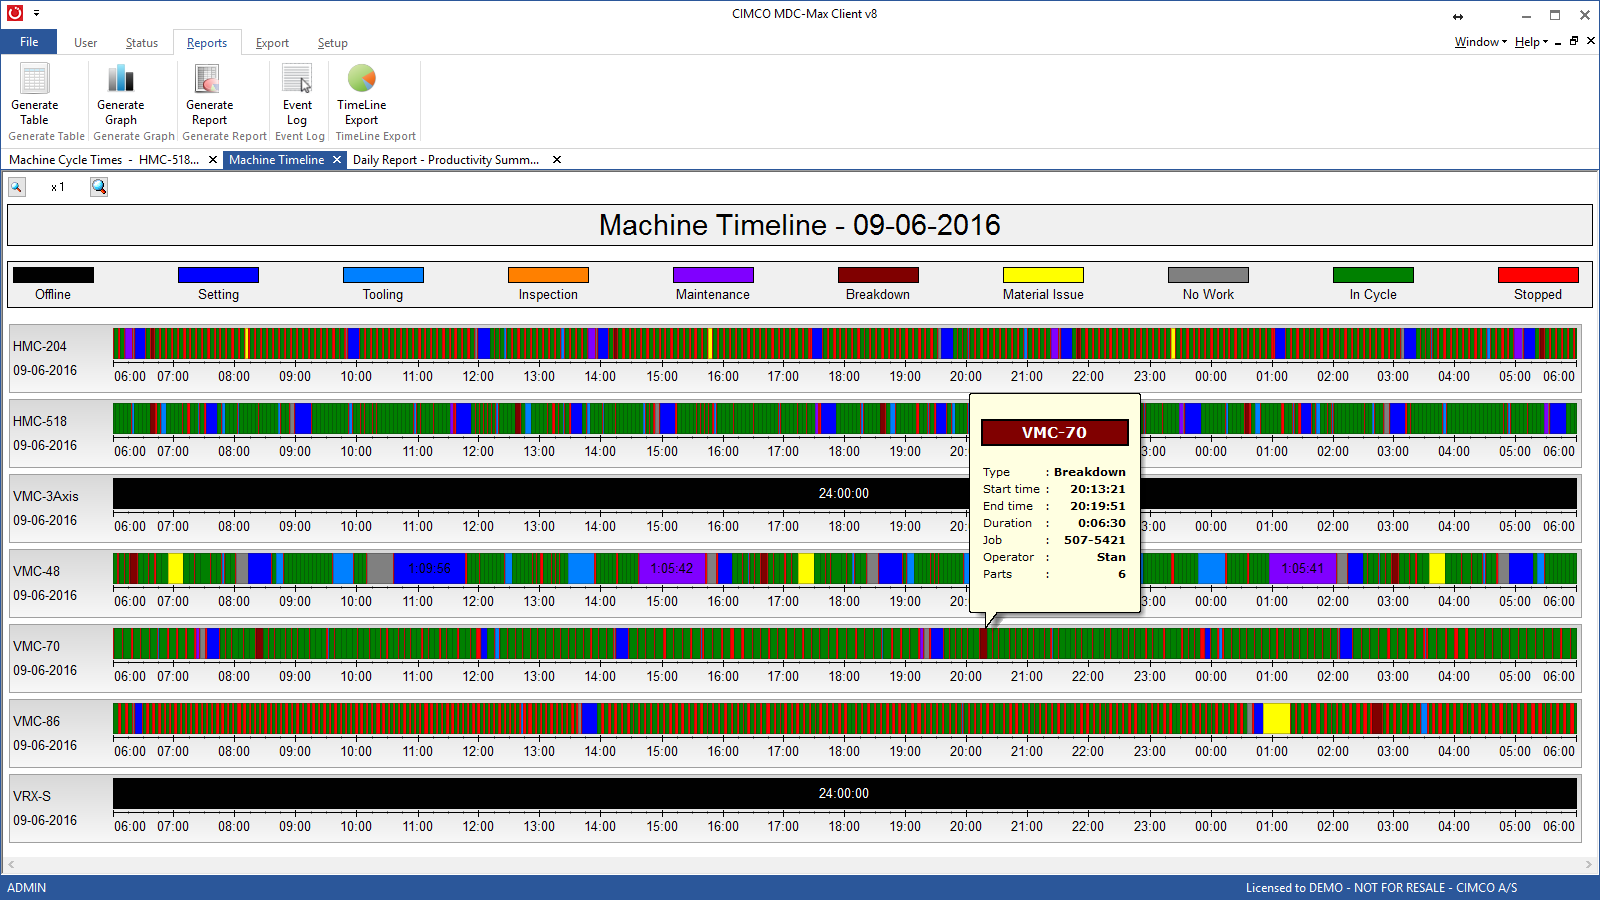
Machine utilization visualized as timeline
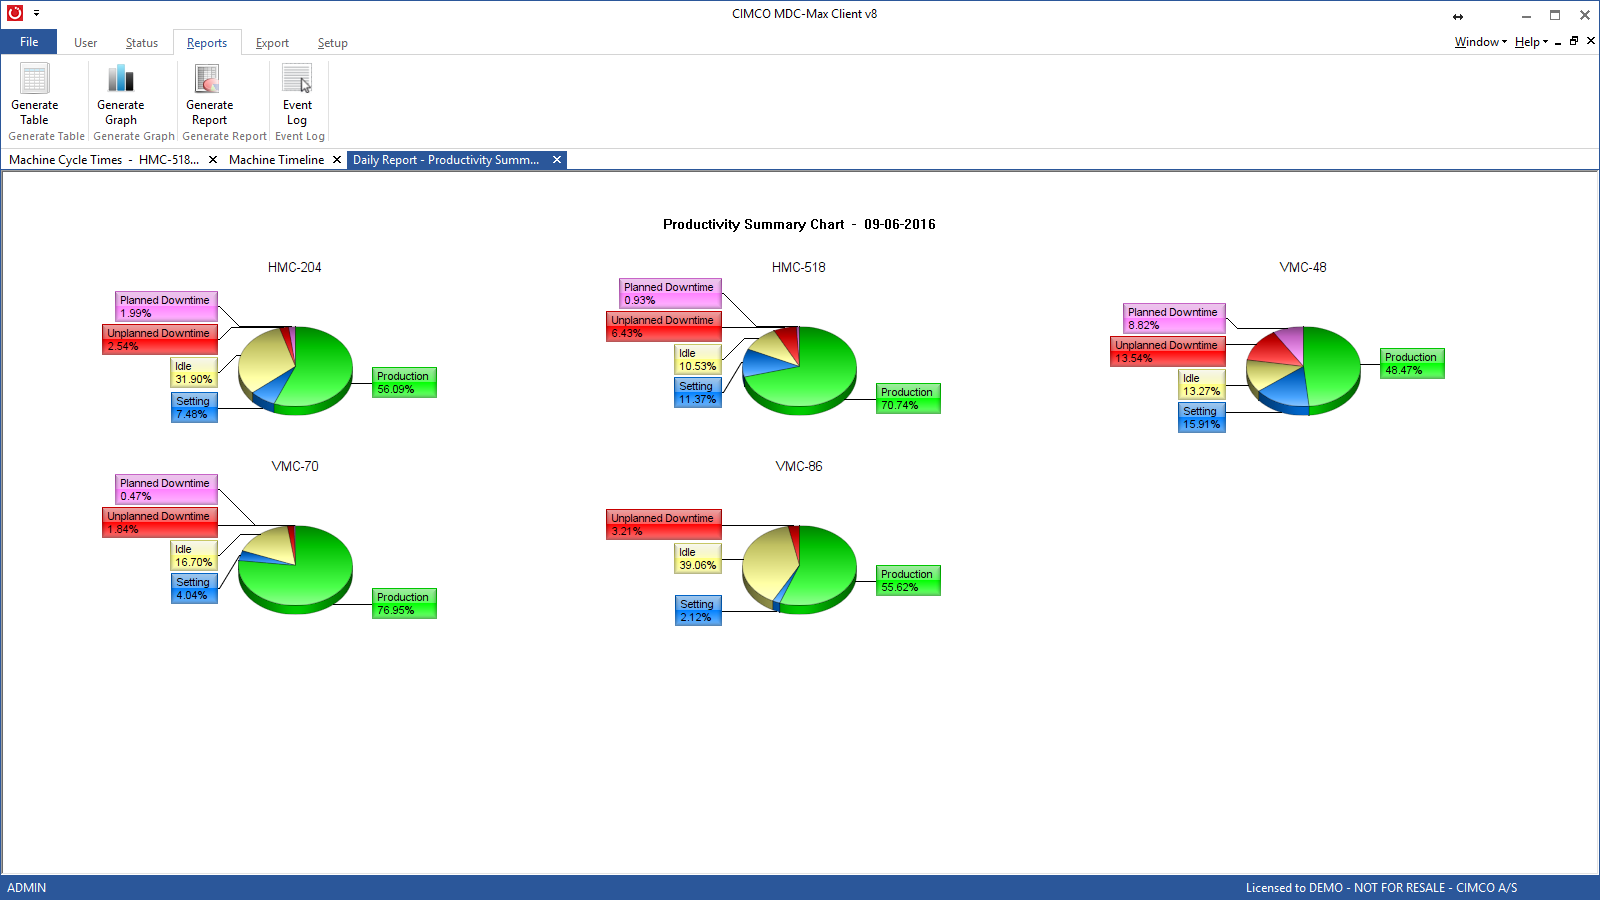
Productivity summary chart
POWERFUL AND FULLY CUSTOMIZABLE
MDC-Max comes with built-in reports, but the true power lies in its ability to create customized reports. Visualize data as tables, pie or bar charts, add in production targets, work shifts, calculate key performance indicators such as OEE, MTBF, MTTR, and more. You can also generate event logs chronologically by operator, machine, and job to know exactly how each machine and operator is performing.
MDC-Max also supports dynamic reporting where data is updated in real-time. Machine status can be visualized as timelines or Gantt charts with status changes shown with different bar colors so you can see at a glance what is going on.
EXAMPLES OF REPORTS
- Cycle time per part (min, max and average)
- Number of parts per shift/operator
- Number of scrapped parts
- Machine downtime
- Scheduled maintenance
- Unscheduled maintenance
- Setup time per part
- Operator effectiveness
- Overall Equipment Effectiveness (OEE)
- Mean time between failures (MTBF)
- Mean time to repair (MTTR)
INTEGRATION WITH OTHER SYSTEMS
CIMCO MDC-Max comes with full support for Microsoft Excel spreadsheets. Reports can be exported easily for further analysis in Excel. MDC-Max can even update your Excel spreadsheet automatically, so the latest data is always available.
CIMCO MDC-Max can also be integrated with most ERP/MPS systems on the market. This means you can have a completely integrated solution that can significantly reduce administrative tasks.
Please contact us for more information about how CIMCO MDC-Max can be integrated with your software systems.
REAL-TIME MONITORING
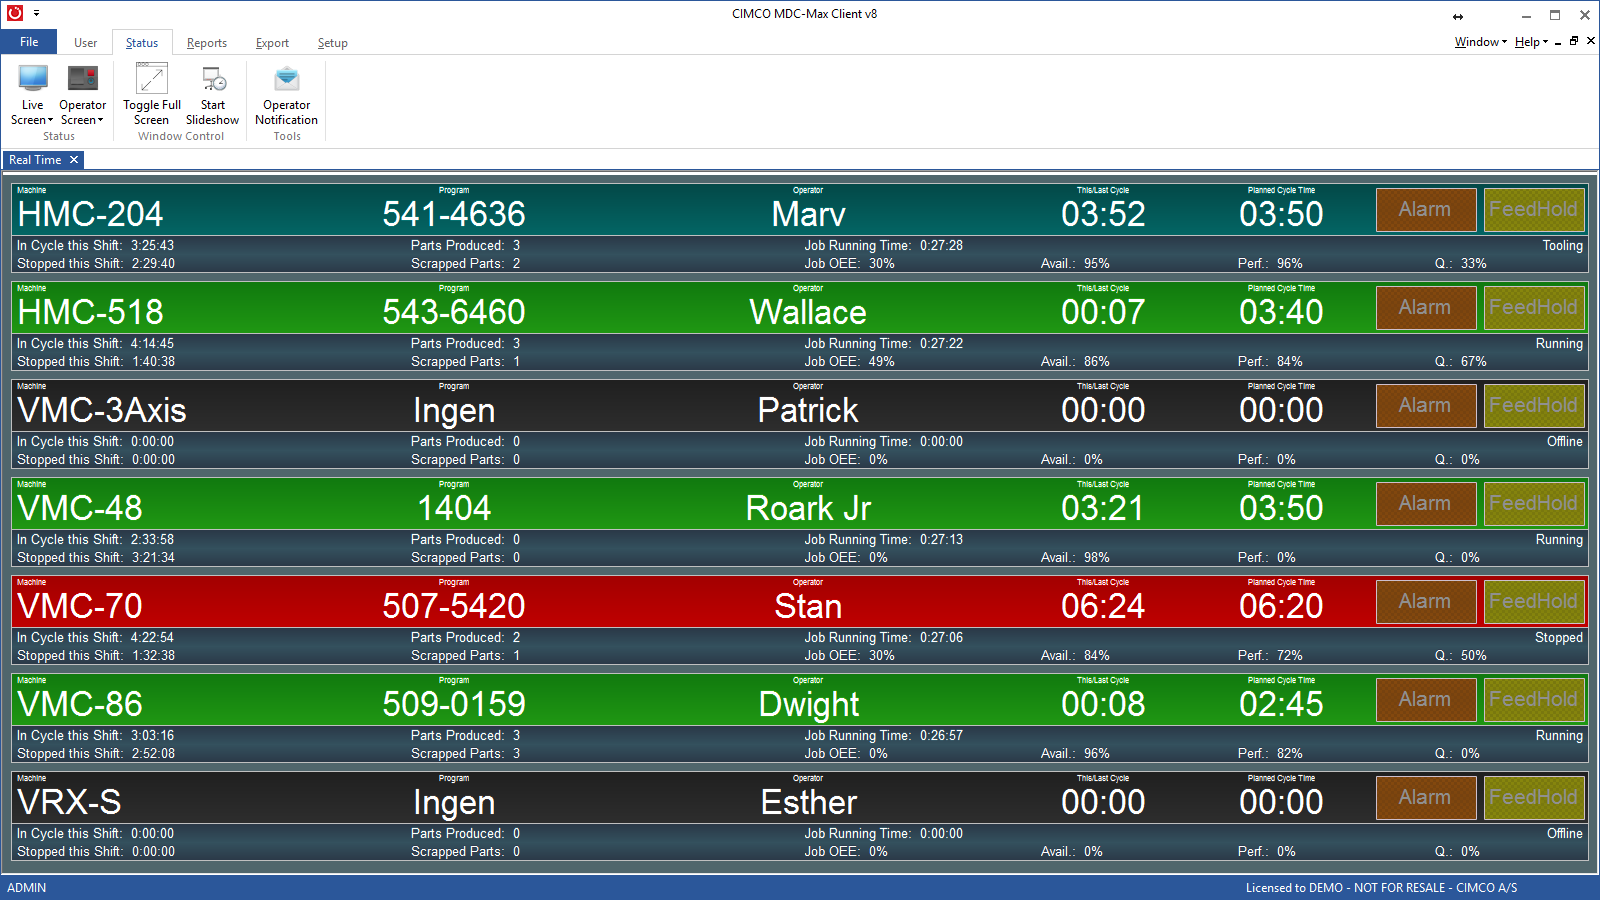
One of the unique features of CIMCO MDC-Max is the Live Screen feature which provide a great status overview for every machine and can be displayed on large plasma or LCD screens. Live Screens can be configured to show a list of all machines and their current status. Further, data such as machine name, job name, part count, running time, downtime, etc. can be associated with each machine to provide a complete overview.
THE MDC-MAX WEB CLIENT
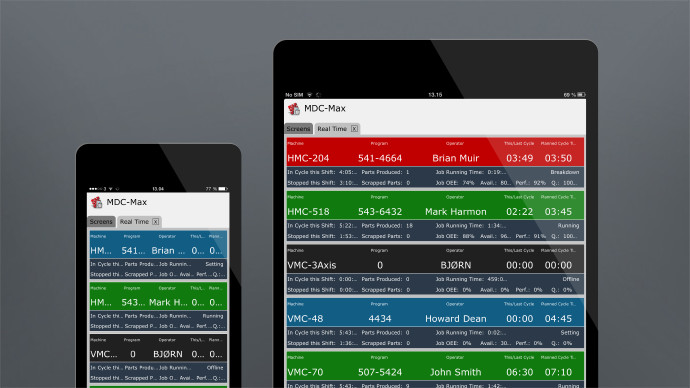
Live Screens are normally displayed on large TV screens that are installed in convenient locations so that all personnel can easily see the status of each machine. However, Live Screens can also be displayed on smartphones, tablets, and touch screens using the MDC-Max Web Client and can thereby be viewed on any device with a browser and internet connection.
LIGHTS-OUT MONITORING

If machines are running unattended MDC-Max can be configured to send an email and a text message to a stand-by operator's or supervisor's smartphone if a machine stops.
NETWORK OPTIONS
CIMCO MDC-Max can easily be added to your existing network supporting a variety of hardware options including serial wiring, Ethernet or a wireless networking. MDC-Max collects information from machines connected to your network either directly (direct connection) or using additional hardware (hardware connection). The data collection method depends on your specific type of machine and its monitoring capabilities.
DIRECT CONNECTION
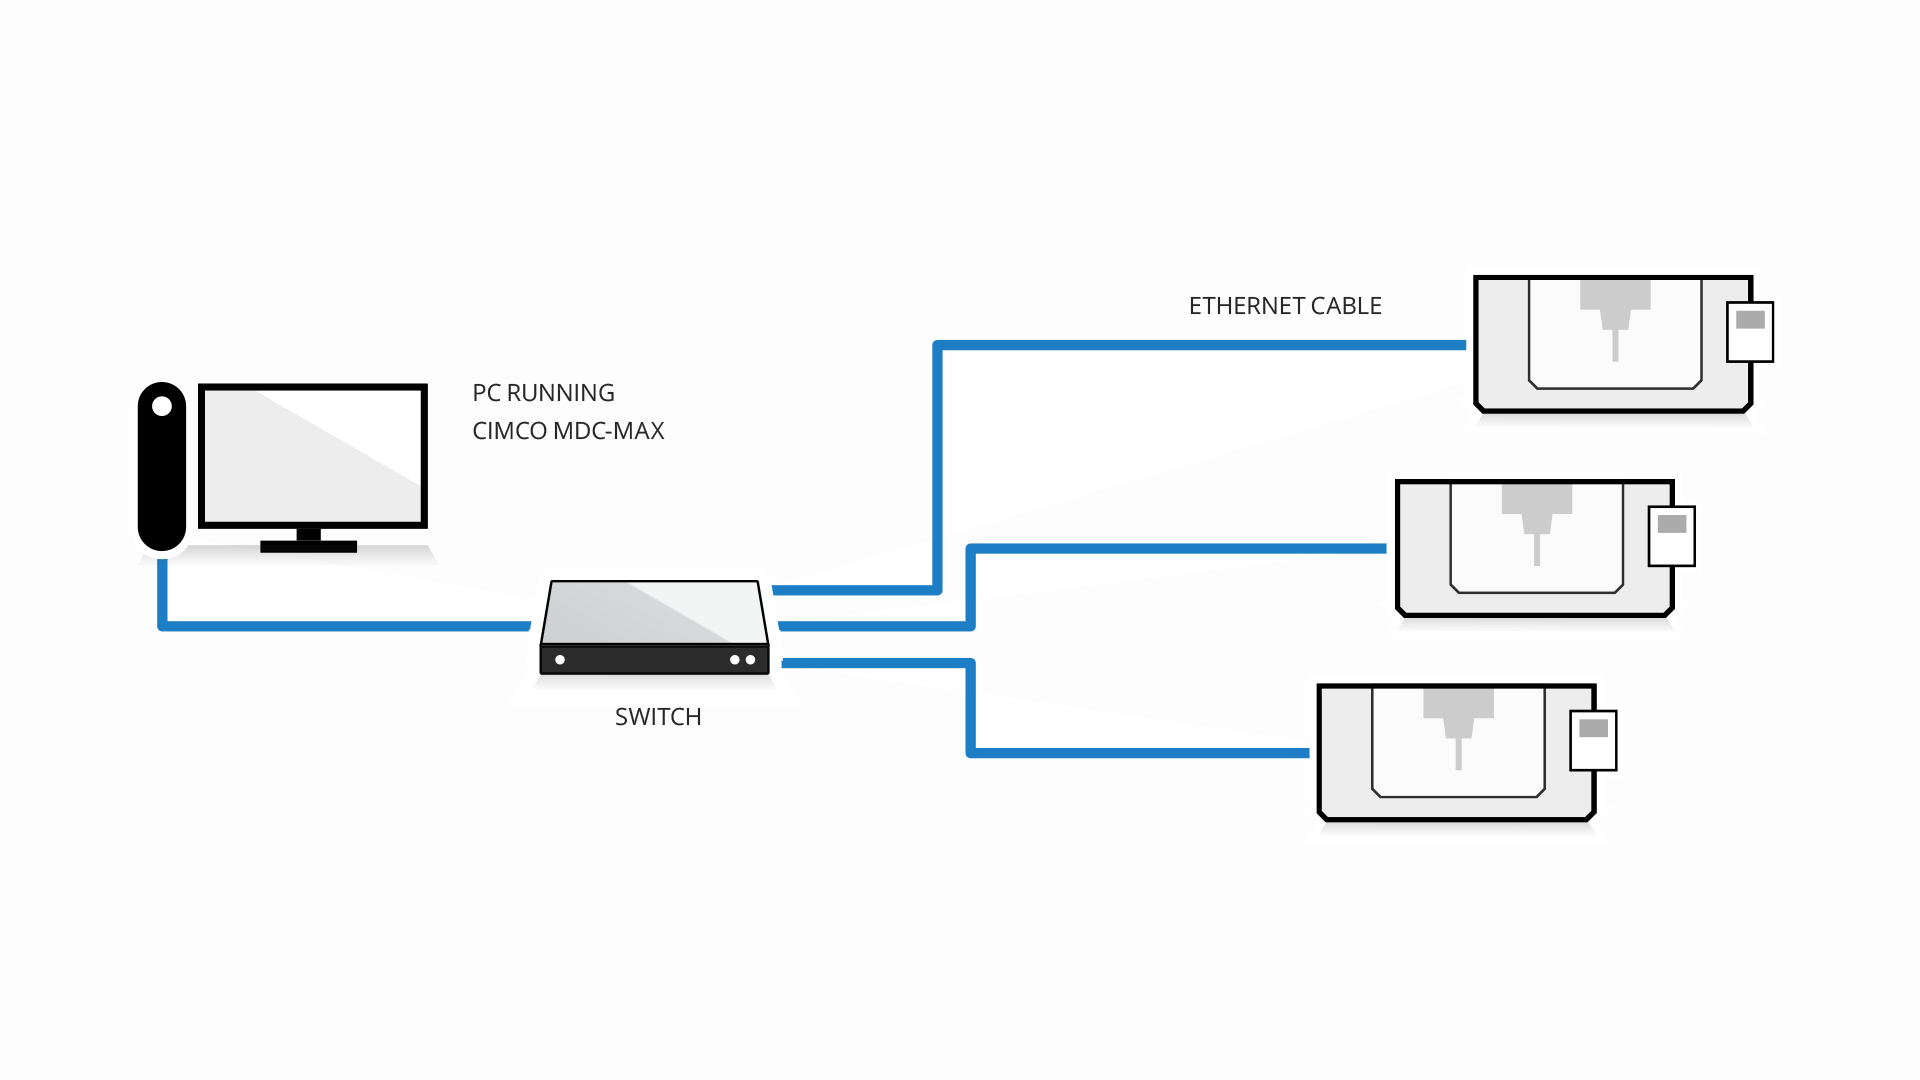
If the machine you wish to monitor has one of the data collection interfaces available (see table below), a direct connection can be achieved by simply connecting an Ethernet cable to the machine. In this case no additional hardware is required beyond what might be needed for operator input (e.g. tablet). However, it can be costly to activate or install the monitoring feature if not enabled on a machine control and a Hardware connection might be preferred.
HARDWARE CONNECTION

If your machine does not support one of the monitoring interfaces signals can be acquired from the machine using an input device such as the Moxa ioLogik device. These devices handle the connection between your machine and network and facilitate signal transmission, in the form of machine event data, to MDC-Max.
SUPPORTED MACHINE CONTROLS
The following machine controls are just some of the many controls we support for direct connection. If your control is not listed please contact us for information about your specific machine and control.
| Control | Required interface | Extent of data access |
|---|---|---|
| Fanuc | FOCAS | Full compatibility |
| Haas | M-Net | Full compatibility |
| Mazak | MTConnect | Full compatibility |
| Okuma | MTConnect | Full compatibility |
| Mitsubishi | MTConnect | Full compatibility |
| NUM | MTConnect | Full compatibility |
| Heidenhain | DNC Opt #18 | Full compatibility |
| Siemens (840D, 810D) | Hardware adapter | Most compatibility |
We are continuously adding support for additional machines.